Version 1.5.2
Released: April 14, 2026
This release introduces smarter notification targeting and enhanced system change visibility. Notifications are now delivered only to the specific user roles configured in the system, ensuring that alerts reach the right people without noise. A new automated alert highlights incidents created with an injury date older than a configurable number of days, helping administrators identify and correct statistical anomalies early. Additionally, notifications are now organized by service, allowing users to quickly filter and search through alerts by the relevant system service.
Role-Based Notification Targeting
Notifications are now sent exclusively to users whose roles have been configured to receive them. This ensures that each alert reaches only the relevant personnel, reducing noise and improving accountability across the system.
- Notifications delivered only to specifically configured user roles
- Administrators can define which roles receive which notification types
- Reduces irrelevant alerts for users who don't need them
- Improves signal quality and response prioritization
- Supports fine-grained control per notification category
- Helps track system changes by ensuring responsible roles are always informed
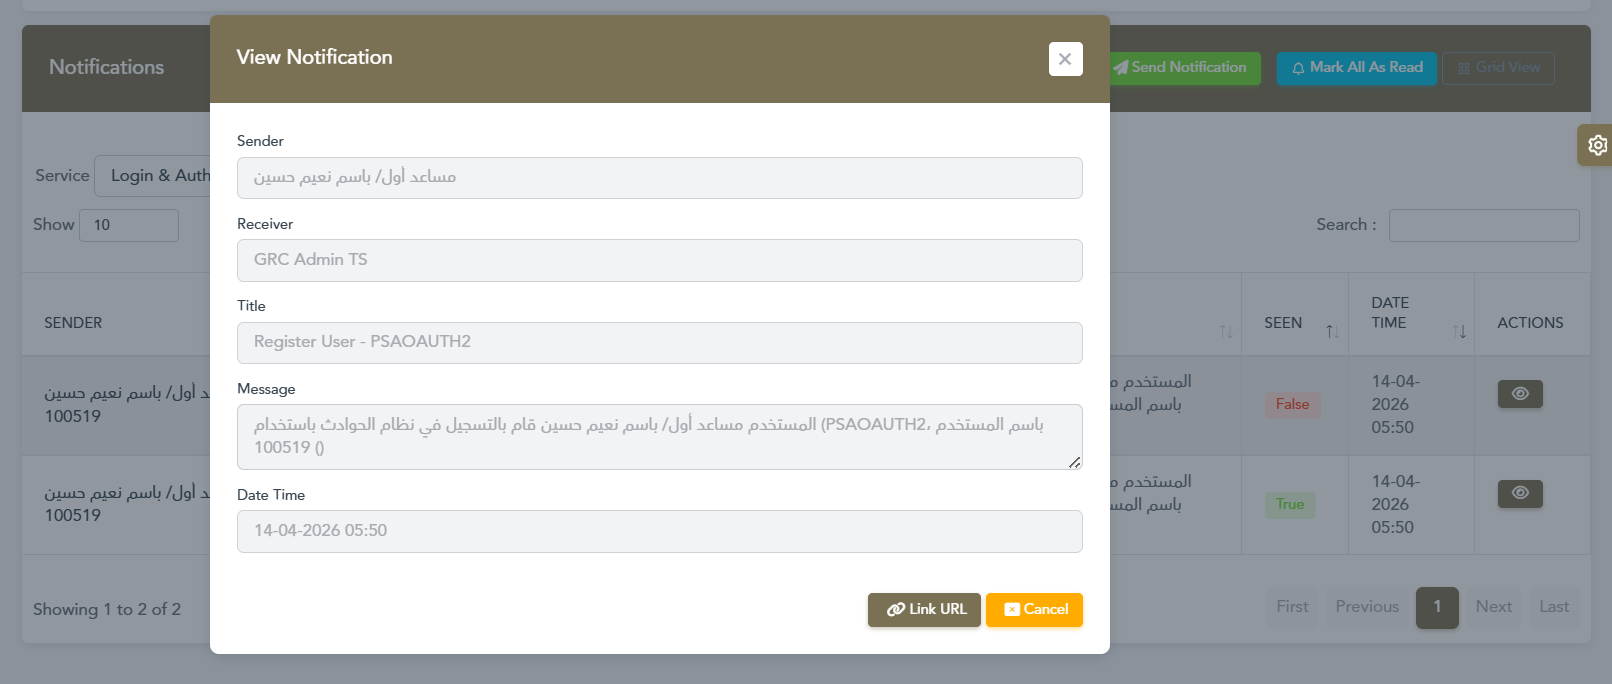
Notification sent to the configured admin role upon a third-party user registration (Login & Auth service)
Old Injury Date Detection Alert
When a new incident is created with an injury date older than a configurable number of days, the system automatically sends a notification to the designated roles. This helps administrators identify back-dated entries that may skew statistics and take corrective action promptly.
- Automatic alert triggered when injury date exceeds the configured day threshold
- Threshold (e.g. 20 days) is fully configurable by administrators
- Notification includes the incident reference number for quick lookup
- Only sent to roles configured to receive this alert type
- Prompts responsible users to re-check and verify statistics
- Helps maintain data accuracy and reporting integrity
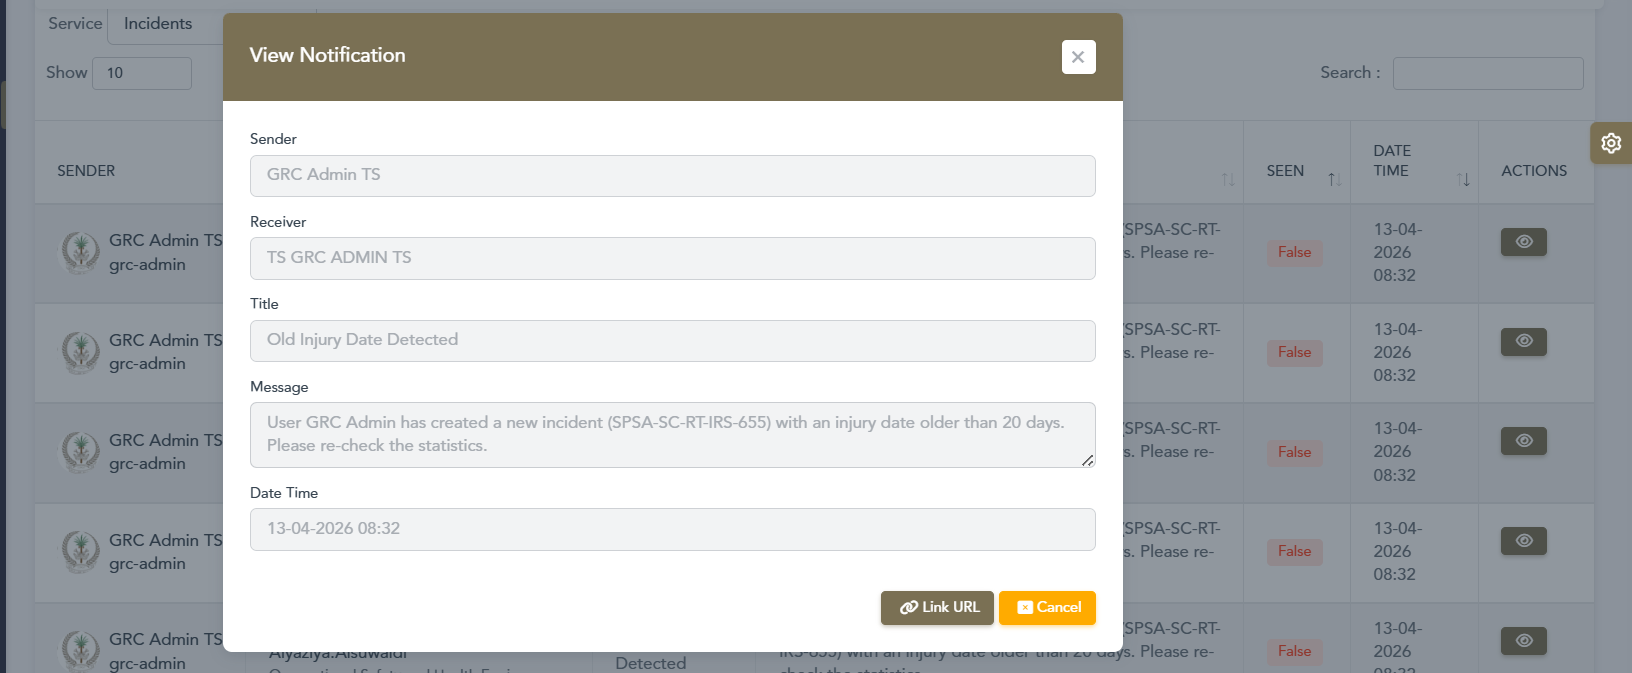
Alert triggered for incident SPSA-SC-RT-IRS-655 with an injury date older than 20 days
Search & Filter Notifications by Service
Notifications are now categorized by the system service that generated them. Users can filter their notification inbox by service name (e.g. Incidents, Login & Auth) to quickly find relevant alerts and track changes across specific parts of the system.
- Notifications organized and labeled by their originating service
- Service filter dropdown available directly on the notifications page
- Quickly isolate alerts from Incidents, Login & Auth, or other services
- Helps users track what changed and in which part of the system
- Improves notification discoverability in high-volume environments
- Works alongside the existing search and pagination controls
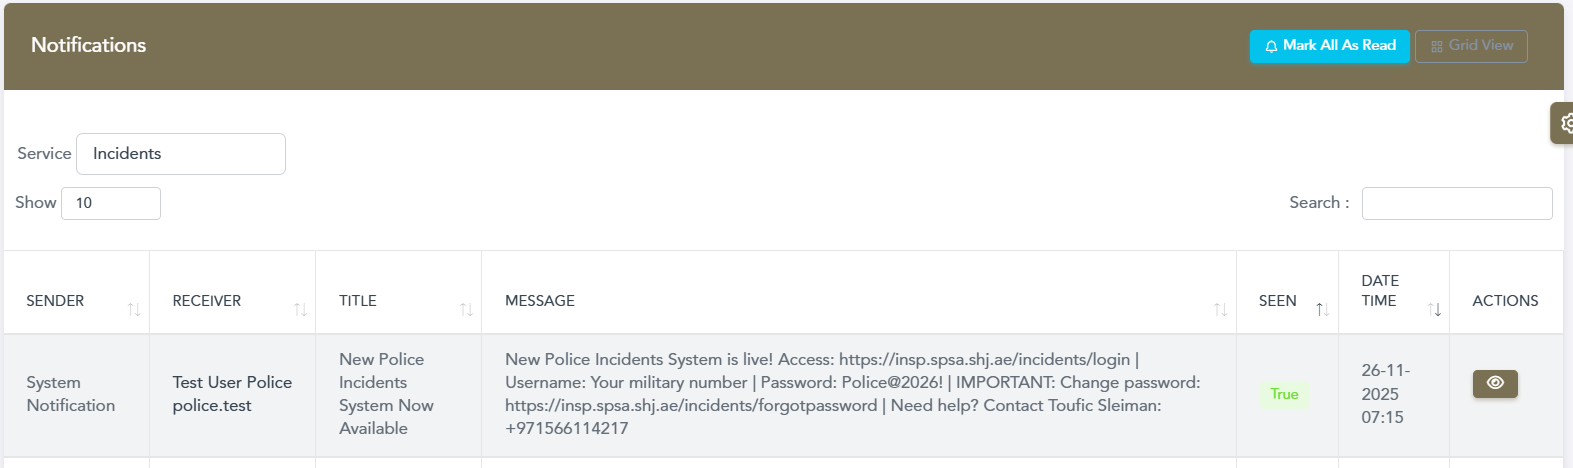
Filtering notifications by the "Incidents" service to track incident-related system changes
Version 1.5.1
Released: February 9, 2026
This release introduces significant improvements to the notification system, enhanced reporting capabilities with station-specific analytics, improved incident visibility with color-coded severity indicators on maps, and better user accountability features. These updates focus on streamlining workflows, improving situational awareness, and providing better insights for decision-making.
Grid View Toggle
Switch between Table View and Grid View to visualize incidents in a card-based layout. The Grid View provides a more intuitive visual representation of incidents with color-coded severity indicators and quick access to key information at a glance.
- Toggle between Table and Grid view layouts
- Card-based visualization of incident data
- Color-coded left borders for severity levels (Green/Blue/Red)
- Quick access to incident ID, Name, Mobile, Impact, Date, Status
- Improved visual scanning and data comprehension
- Responsive grid layout that adapts to screen size

Grid View displaying incident cards with color-coded severity
Show/Hide Nationality Column
Toggle the visibility of the Nationality column in the incident table with a single click. Users can easily show or hide this column based on their reporting needs and preferences, streamlining the table view for better data analysis.
- Toggle Nationality column visibility with dedicated button
- Customize table view based on specific reporting requirements
- Improved table readability with flexible column management
- One-click access to demographic data filtering
- Better control over displayed information
- Enhanced data privacy options for sensitive reports

Toggle nationality column visibility in table controls
Show/Hide Age Column
Control the visibility of the Age column in your incident table view. This feature allows analysts to focus on relevant data by hiding or displaying age information as needed, improving efficiency in data review and analysis workflows.
- Quick toggle button to show or hide Age column
- Customize incident table layout for specific analysis needs
- Reduced clutter for focused incident review
- Better data organization for different reporting scenarios
- Enhanced privacy control for age-sensitive data
- Improves focus on critical incident information
Toggle age column visibility alongside nationality controls
Export Filtered Incidents
Export incident data with all applied filters preserved, enabling users to extract customized datasets based on their specific criteria. This feature allows analysts to generate targeted reports with only the relevant incidents matching their filter parameters.
- Export respects all active filters and search parameters
- Generate customized data exports for analysis and reporting
- Maintain filter criteria in exported files for reference
- Streamlined workflow for creating focused datasets
- Better data management for specific incident subsets
- Efficient report generation based on filtered results
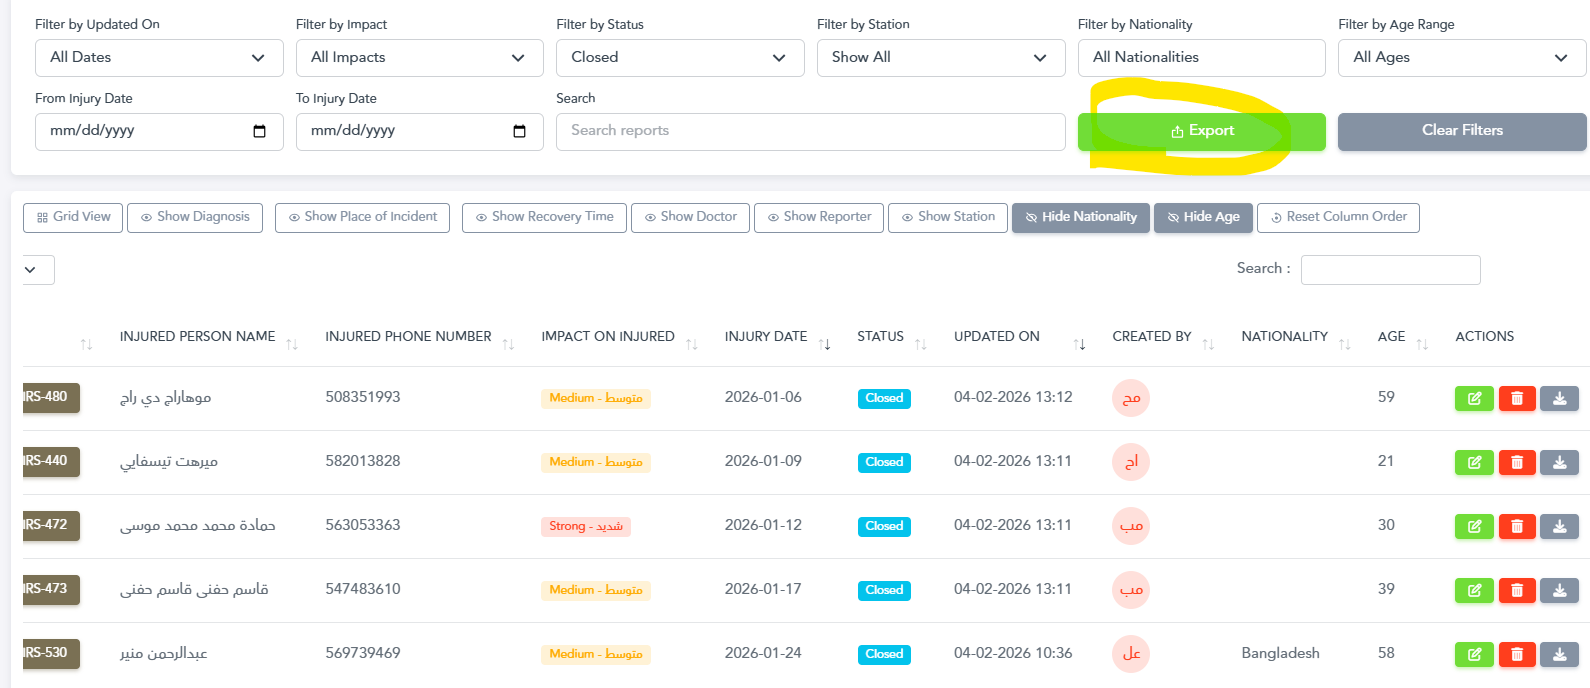
Export button with filtered incident data and visible columns
Edit Profile Details
Update your profile details from the profile page.
- Modify user profile details
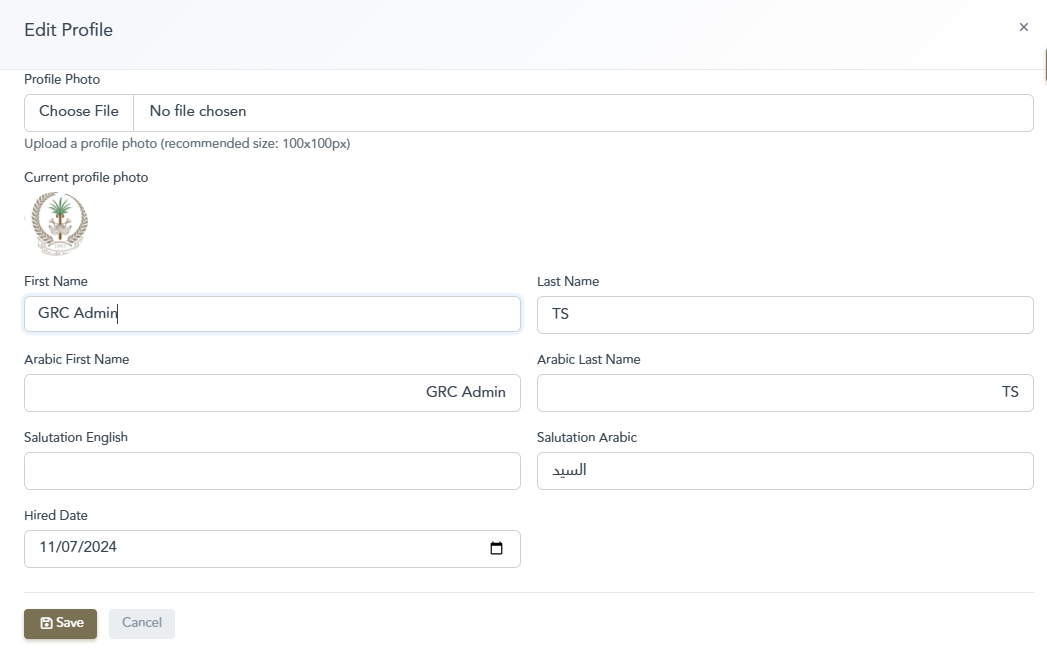
Profile Page Changes
Mark All Notifications as Read
Efficiently manage your notification inbox with the new "Mark All as Read" functionality. This feature allows users to clear multiple notifications at once, streamlining the notification management workflow and saving valuable time, especially for managers and operators dealing with high notification volumes.
- One-click button to mark all notifications as read instantly
- Smart confirmation dialog to prevent accidental bulk actions
- Improved notification management workflow for high-traffic users
- Faster inbox cleanup for busy managers and operators
- Better notification organization and reduced clutter
- Helps maintain focus on new and critical alerts
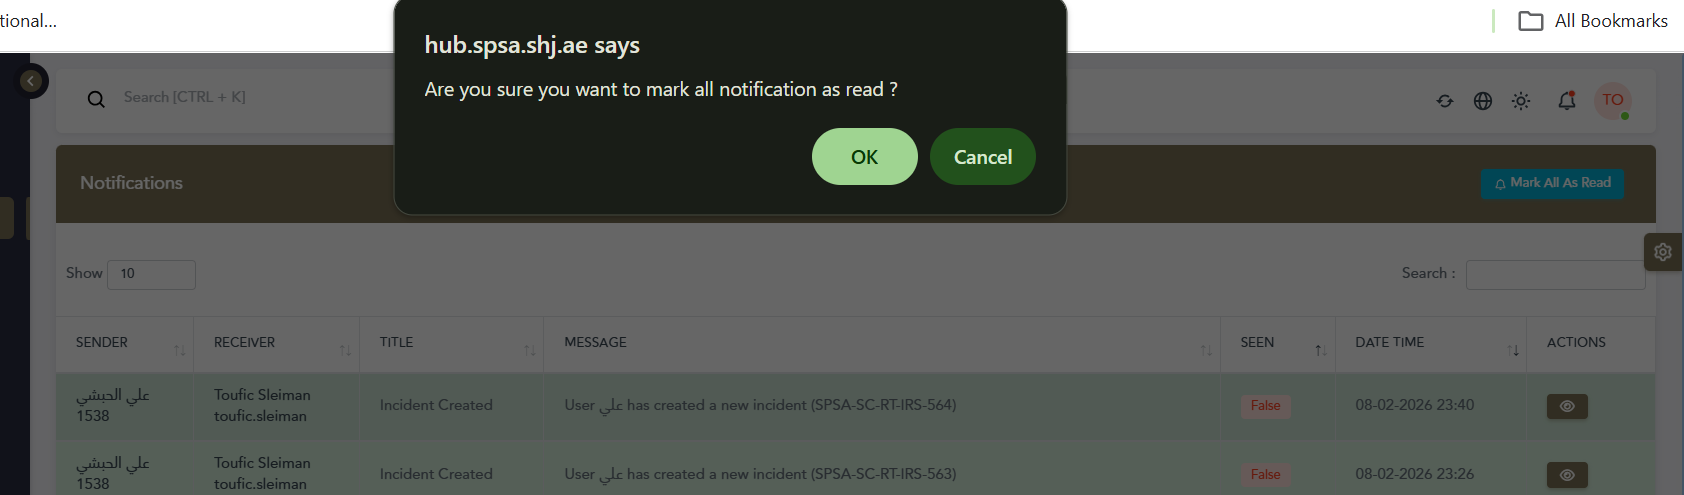
Confirmation dialog for marking all notifications as read
Manager Role Incident Notifications
Users with manager roles now receive real-time notifications when new incidents are created in the system, ensuring immediate awareness of critical events. This automatic notification system keeps leadership informed and enables faster response coordination.
- Automatic push notifications for manager-level users
- Real-time alerts when incidents are created in the system
- Detailed notification panel showing incident information
- Quick access to newly created incidents from notification
- Enhanced incident tracking and improved response time
- Better team coordination and situational awareness

Managers receive real-time incident creation notifications
Enhanced Status Display with Creator Information
Status badges now display the creator's username directly, providing better accountability and transparency in the incident management workflow. This improvement makes it easier to track who is responsible for incident updates without needing to open additional dialogs.
- Username displayed directly alongside status indicators
- Quick identification of who created or updated incidents
- Improved audit trail visibility at a glance
- Better team collaboration and accountability
- Enhanced incident tracking and ownership clarity
- Reduced need to open hover dialogs for basic information

Status display showing creator username badge
Station-Specific Monthly Reports
Generate detailed monthly incident reports for individual police stations with comprehensive analytics and interactive trend visualization. This feature enables station commanders to analyze their specific incident patterns, identify peak periods, and make data-driven decisions for resource allocation.
- Filter monthly reports by specific police station
- Interactive monthly trend analysis with peak incident identification
- Year-over-year comparison capabilities for historical analysis
- Visual charts showing incident distribution across months
- Station-specific performance metrics and KPIs
- Export capabilities for further analysis and reporting
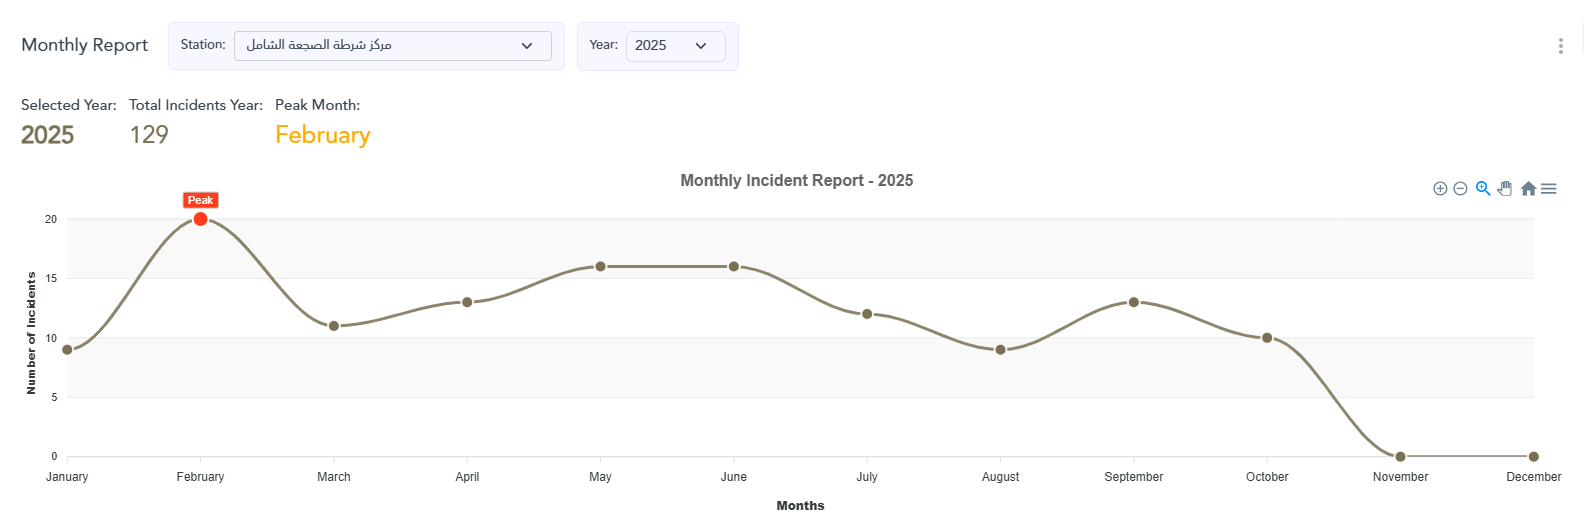
Monthly incident report for individual station (2025)
All Stations Comprehensive Reports
View aggregated monthly reports across all police stations for a complete overview of incident patterns and trends throughout the entire Sharjah Police jurisdiction. This system-wide view helps senior management identify regional trends and make strategic resource allocation decisions.
- Comprehensive view of all stations combined in one report
- Total incident count aggregated across all locations
- Peak month identification for system-wide resource planning
- Regional trend analysis and pattern recognition
- Strategic insights for senior management decisions
- Comparative analysis capabilities across different time periods
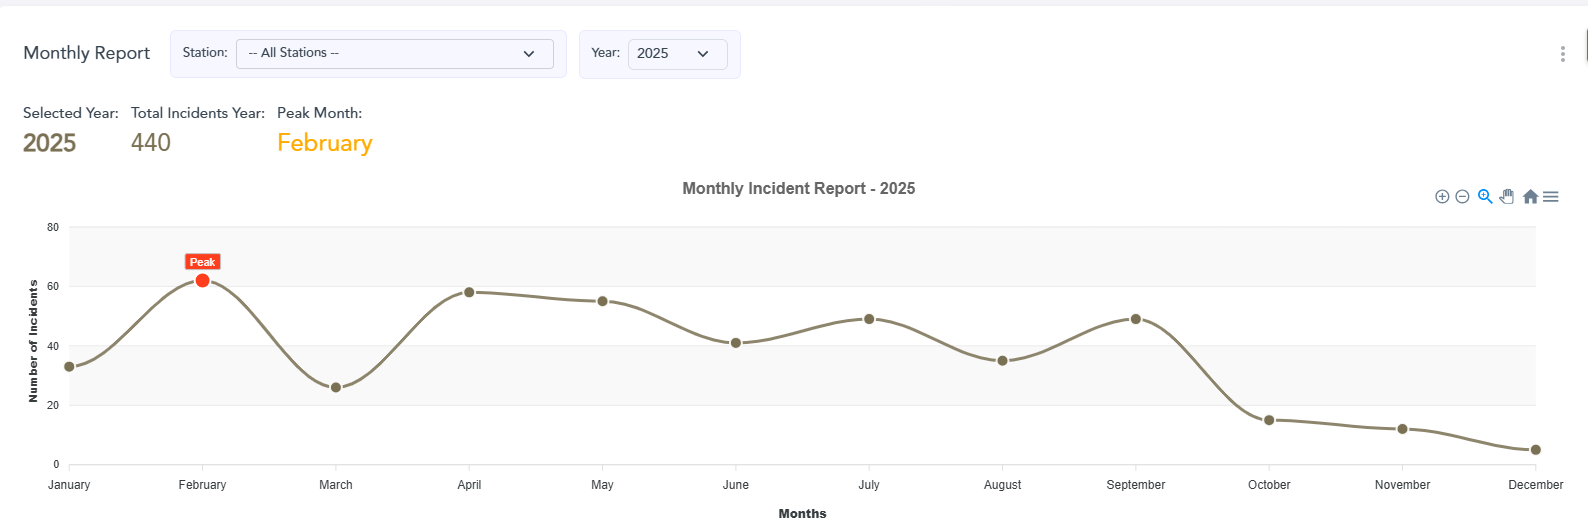
Comprehensive monthly report for all stations combined
Map Severity Indicators - Strong
Enhanced map visualization with clear severity indicators, displaying "Strong" severity incidents with distinct red visual markers for immediate identification of critical situations. This color-coding system enables emergency responders to quickly prioritize high-severity incidents on the map interface.
- Color-coded severity markers on interactive map interface
- "Strong" severity highlighted with red markers for critical incidents
- Instant visual assessment of incident severity levels
- Improved situational awareness for emergency response teams
- Faster priority-based response planning and dispatch
- Geolocation clustering for better visualization of incident hotspots
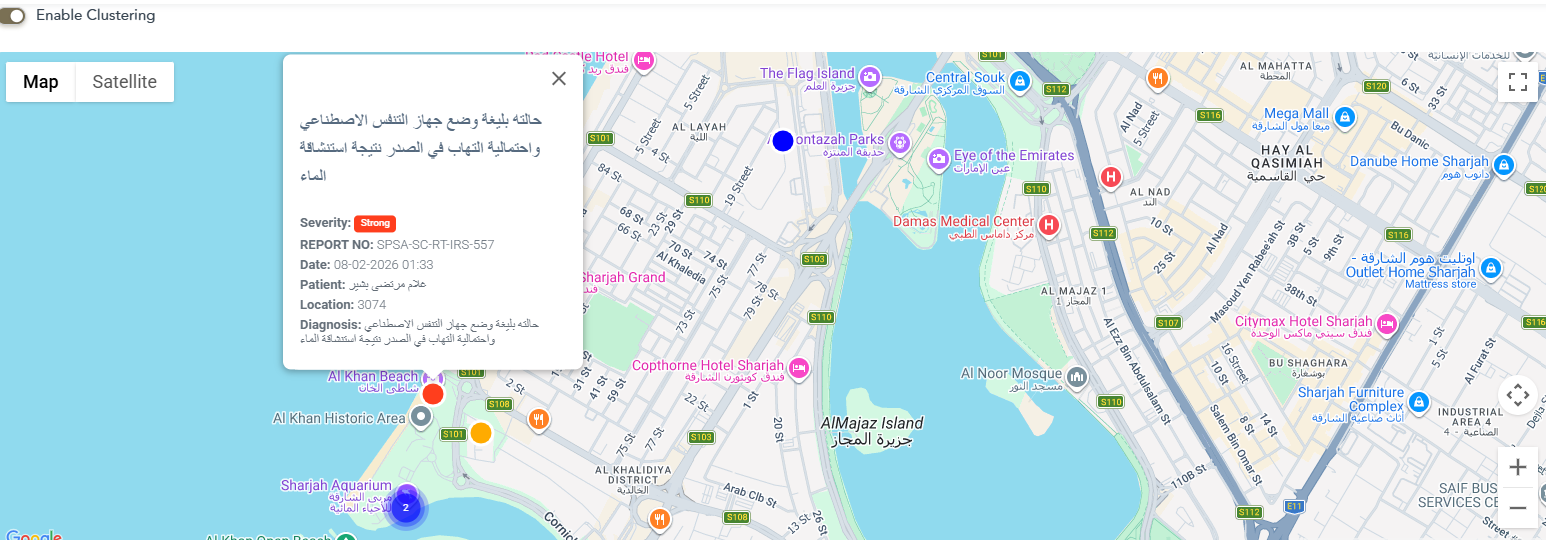
Map displaying strong severity incident with red marker
Map Severity Indicators - Medium
Medium severity incidents are displayed with orange/yellow visual indicators on the map, helping teams prioritize response efforts based on incident urgency and allocate resources effectively. This middle-tier severity level ensures balanced response planning between critical and routine incidents.
- Medium severity marker with orange/yellow color coding
- Clear visual hierarchy of incident priorities on map
- Improved incident categorization and classification
- Better resource allocation and deployment planning
- Enhanced map readability and user experience
- Quick identification of moderate-risk incidents requiring attention

Map displaying medium severity incident with orange marker
Map Severity Indicators - Weak
Weak or low-severity incidents are clearly marked on the map with blue visual indicators, ensuring all incidents are visible while maintaining clear priority distinctions from medium and high severity cases. This comprehensive visibility prevents minor incidents from being overlooked while they can still be addressed efficiently.
- Weak severity indicator with blue color coding for lower-priority incidents
- Complete incident visibility regardless of severity level
- Comprehensive map coverage for all incident types
- Better understanding of all incident patterns and trends
- Complete situational awareness across the entire region
- Prevents overlooking minor incidents that may escalate over time
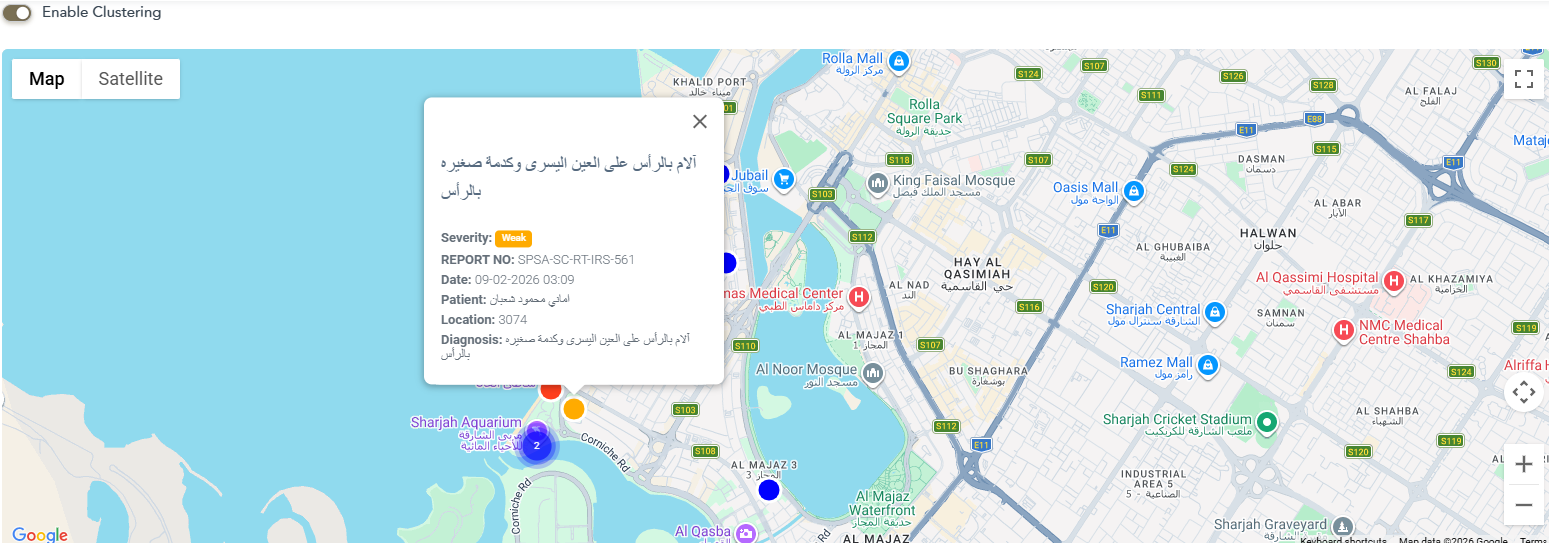
Map displaying weak severity incident with blue marker
Version 1.5.0
Released: February 2, 2026
This release focuses on improving transparency and user experience with enhanced tracking capabilities, better incident management features, and customizable table views. The update introduces comprehensive audit trails, flexible column ordering, and improved data export functionality.
Close Incident Feature
The readiness team can now officially close incidents when they are resolved, providing clear incident lifecycle management and better tracking of resolved cases.
- Ability to mark incidents as closed by authorized readiness team
- Display closed incidents with distinct visual indicators
- Filter incidents by open or closed status
- Improved incident lifecycle management and tracking
- Better reporting on incident resolution rates
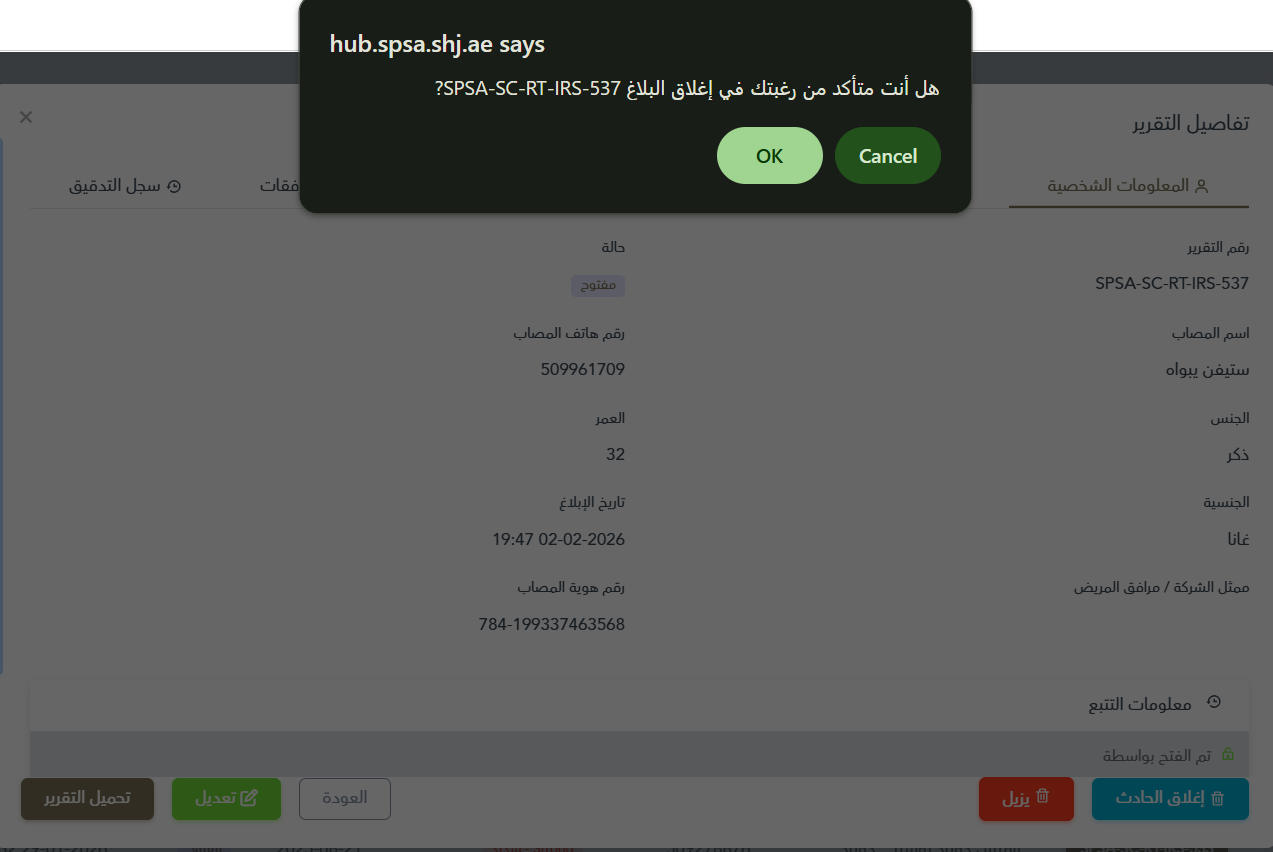
Close incident feature for readiness team
Injury Date Column & Filtering
New injury date column added to the incident list view with advanced filtering capabilities, allowing users to search and filter incidents by injury date range.
- Injury date column visible in incident table
- Date range filter: search by injury date from-to
- Visual highlighting of recently added incident rows
- Improved data organization and searchability
- Better tracking of incident timelines
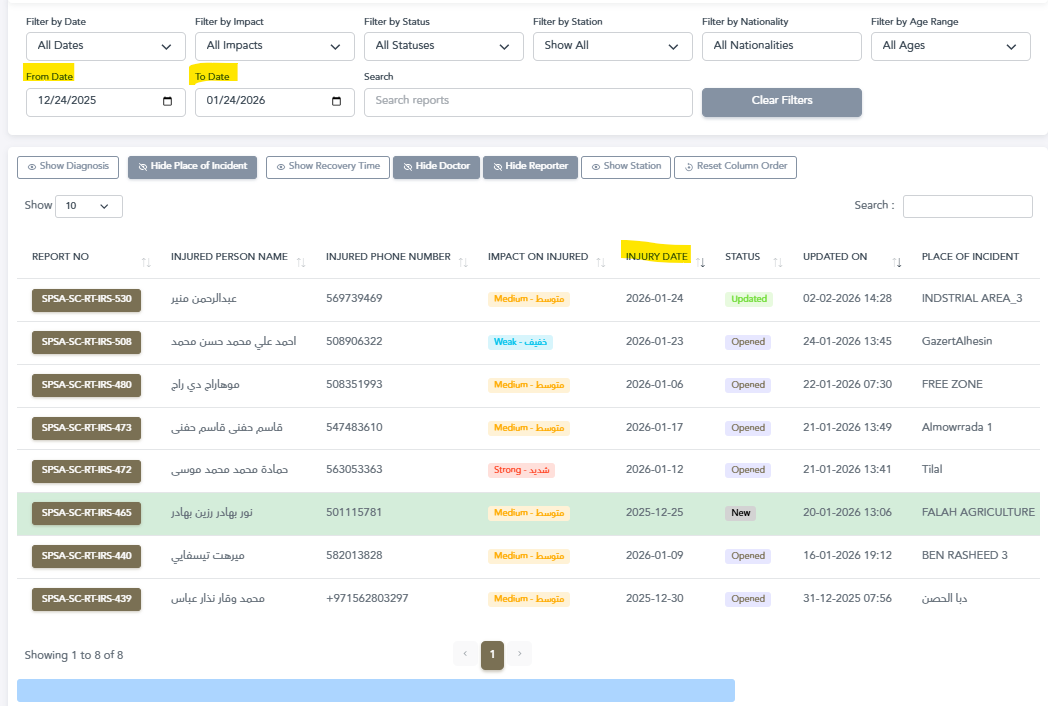
Injury date column with filtering capabilities
Customizable Column Order
Personalize your incident table view by dragging and dropping columns to your preferred order, with the ability to reset to default layout anytime. This flexibility helps users optimize their workflow based on their specific needs.
- Drag and drop columns to rearrange table layout
- Customize view based on your workflow preferences
- Column order persists across sessions
- One-click reset to restore default column order
- Improved data visibility and navigation

Drag columns to reorder your table view
Reset Column Order Button
Easily restore the default column layout with a single click using the new "Reset Column Order" button, providing a quick way to return to the standard view.
- Quick access reset button in table toolbar
- Instantly restore original column arrangement
- Clear visual indicator with refresh icon
- No confirmation needed for immediate reset

Reset to default column order with one click
Update Status Hover Details
Hover over incident status indicators to see who opened or updated the incident with detailed user information, providing quick access to audit information.
- Instant visibility of who opened each incident
- Track who last updated the incident
- Quick access to user information without clicking
- Legacy data note: Old system data may not show these details

Hover to see who opened/updated incidents
User Information Display
Enhanced user interaction with intuitive name display and quick access to complete user listings for improved team collaboration.
- Hover over user avatar to see their full name
- Click user avatar to view complete list of all system users
- Improved user identification and collaboration
- Better visibility for team coordination
Click user avatar to see all users
Enhanced Tracking Information & Audit Trail
Comprehensive tracking and audit trail features for complete transparency and accountability throughout the incident lifecycle.
- Detailed tracking information for all incident activities
- Complete audit trail showing all system interactions
- Historical data preservation from legacy system
- Timestamp tracking for every action
Comprehensive tracking and audit trail
Excel Export Enhancement
Export functionality now includes all available rows without limitations, enabling complete data extraction for comprehensive analysis.
- Export all incident rows (up to 25,000 records)
- No more pagination limitations on exports
- Complete data extraction for analysis
- Improved reporting capabilities

Export all rows to Excel CSV
Enhanced Incident Reports
Downloaded incident reports now include comprehensive tracking information for better documentation and legal compliance.
- Tracking information included in PDF reports
- Complete audit trail in downloadable documents
- Professional formatting for legal documentation
- Enhanced report completeness and accuracy
Reports with comprehensive tracking information